designlab
Overview
I designed a book for designLAB architects showcasing the firm's research methodologies. In addition creating the book itself, I developed data visualization graphics.
The 106-page document breaks down different forms of research into “Social Analysis”, “Survey Analysis”, and “Institutional Analysis”. Each chapter delves into these forms of analysis and the projects at designLAB which utilized these methodologies, whether individually or in tandem with one another.


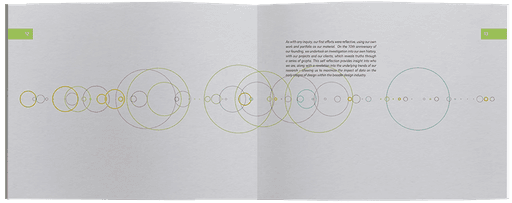
Graph illustrates the success and outcome of each project completed by designLAB since 2005. Color coded by typology, the circumference each circle indicates number of awards for each project. The network of tendrils indicate projects which helped lead to other projects.
Completion of graph provided retrospective outlook on relative success of projects, allowing introspection and greater focus on how designLAB may continue growing as a firm.


Analyzing our success and shortcomings
Usability Test
Feature 1 | Program
You are interested in the 9-month program; find out some information about the program
Users navigated to program directly but struggled to understand program content and information
Developed a visual language to convey information to make it less text heavy
Mid-Fi Insight
Hi-Fi Takeaway
Feature 2 | Mentor Application
You’re interested in getting involved in a nonprofit as a volunteer mentor; apply to become a mentor.
Users were consistently split between navigating to “get involved” or “mentorship” tab
Provided a visual emphasis for mentorship on “get involved” as it is the most common path
Mid-Fi Insight
Hi-Fi Takeaway
Feature 3 | Workshops
You're interested in attending a workshop but don't know what subjects the workshops usually cover, find a past workshop.
Most users struggled finding “workshops” link within the program page
Provided a separate “workshops” page within the navigation bar
Mid-Fi Insight
Hi-Fi Takeaway